A confidence interval describes the uncertainty around an estimated quantity, such as the difference in average leaf length between two cannabis groups. It helps you judge how precisely a study estimated that difference, but it doesn’t tell you where most individual plants will fall or whether the result will transfer to another population. Start by identifying what the interval estimates, then compare its range with the decision you need to make.
If a report gives you a mean and a range without saying what the range represents, pause there. A standard deviation describes spread among observations; confidence and prediction intervals describe uncertainty about different quantities. Substituting one for another can change the conclusion.
Find the quantity behind the range
An interval around a group mean concerns that population mean under the study’s assumptions. An interval around a difference concerns the comparison between groups. A prediction interval concerns a future observation and includes variation that an interval for the mean doesn’t. So an interval of 2 to 8 millimeters for a mean difference doesn’t mean that 95% of plants differ by 2 to 8 millimeters.
The usual 95% confidence interpretation describes a method: across repeated comparable studies, about 95% of the intervals constructed that way would contain the true quantity, assuming the method’s conditions hold. It isn’t a 95% probability assigned to the fixed true value after this particular interval has been calculated. NIST explains this repeated-sampling meaning.
Read the interval against a useful difference
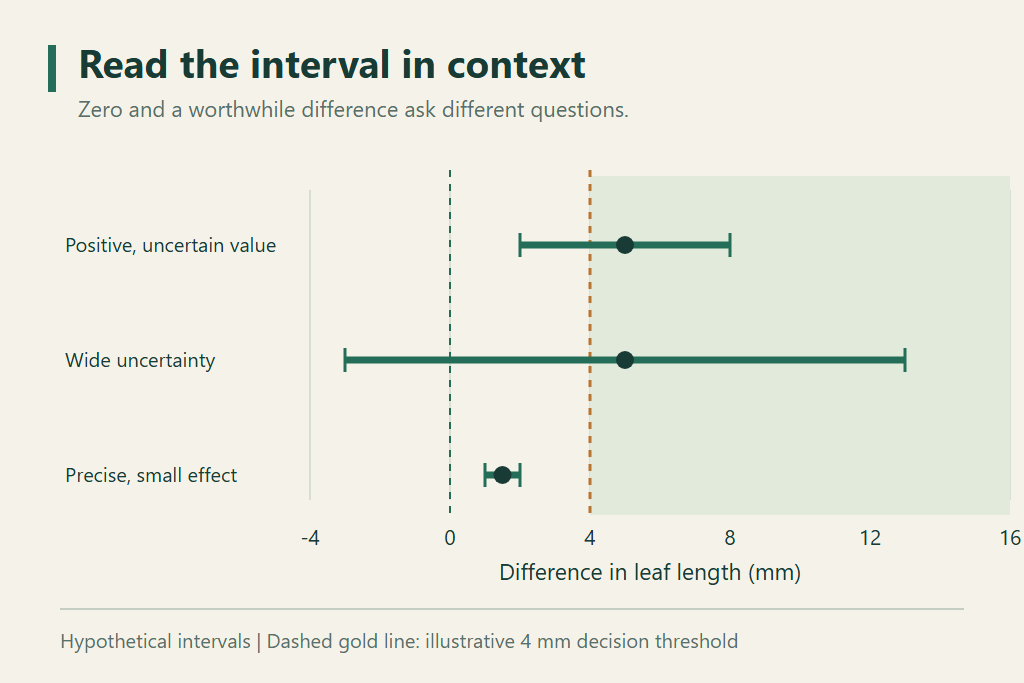
Consider an invented plant-measurement example. Suppose the estimated difference is 5 millimeters and its 95% interval runs from 2 to 8 millimeters. For this example only, imagine that a difference below 4 millimeters wouldn’t justify changing your research procedure.
The interval excludes zero, but it still includes differences too small to justify the change. That gives you evidence of a positive difference under the model without resolving whether it is large enough for your purpose. The 4-millimeter threshold needs a reason connected to the decision; it isn’t a cannabis standard.
Now imagine the same estimate with an interval from -3 to 13 millimeters. It includes zero, modest negative differences and worthwhile positive ones. Calling that result “no difference” hides the uncertainty you most need to understand. For contrast, consider a separate estimate of 1.5 millimeters with a narrower interval from 1 to 2 millimeters. That result would be more precise, but the effect would be below the hypothetical worthwhile threshold.
This is why you should record both the effect size and its uncertainty. When an estimate concerns two inherited traits rather than a simple group comparison, the site’s explanation of genetic correlation helps you identify what the estimated relationship actually means before interpreting its interval.
Check whether the precision was earned
A narrow interval deserves attention only if the analysis respects the experimental design. Three leaves measured on each plant aren’t three independent plants. If you’re unsure what the sample count represents, check what counts as a replicate in a clone trial before accepting the reported precision.
Also look for the units, confidence level, analysis method and any transformation. An interval on a logarithmic scale needs careful interpretation after conversion, and separate intervals around two group means aren’t a substitute for the interval around their difference. Ask for that comparison directly rather than judging significance from whether the two plotted bars overlap.
Confidence intervals address statistical uncertainty from sampling under assumptions. They don’t automatically account for mislabeling, selective reporting, a biased sample or an unsuitable measurement method. More precise estimation of the wrong comparison won’t answer your question.
Turn the range into a bounded conclusion
Write down the estimate, its interval and the smallest difference that would matter, then say what remains unresolved. “The interval supports a positive difference, but still includes effects below our decision threshold” is a usable conclusion because it tells you why further precision might matter.
If the result will guide an expensive research decision, ask a statistician whether the interval matches the experimental unit and analysis plan. Your next step is to resolve that uncertainty, rather than treating a confidence level as permission to generalize beyond the study.