A quantitative trait locus, or QTL, is a region of DNA statistically associated with variation in a measured trait. In cannabis research, a QTL can narrow the search for genetic contributors to traits such as flowering time or plant height, but it’s a region to investigate—not proof that one gene controls the outcome.
Why a QTL Is a Region, Not an Answer
Many traits vary along a continuum rather than falling into two clean groups. The site’s explanation of quantitative traits in cannabis shows why measurements, environment, and multiple genetic effects matter. A QTL analysis asks whether inherited markers in a mapped region tend to travel with higher or lower measurements in the studied population.
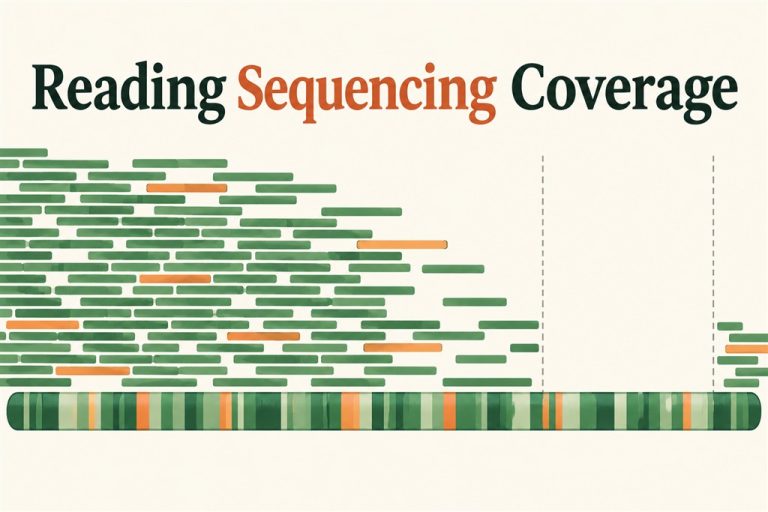
Markers near one another can be inherited together, so the strongest statistical signal may identify a neighborhood containing several candidate genes. The region can also look wider or narrower depending on population size, recombination, marker density, and the analysis used.
Separate Four Parts of a QTL Claim
- Trait definition: What exactly was measured, at what stage, and with what method?
- Study population: Which parents, families, or accessions produced the variation?
- Mapped interval: Which reference genome and marker boundaries define the region?
- Evidence strength: How much variation did the model attribute to the region, and was the result repeated?
This four-part note prevents a common mistake: turning “a region was associated with the trait in this population” into “this gene determines the trait in cannabis.” Those statements don’t mean the same thing.
How QTL Mapping Differs From a Single Marker
A marker can help track inheritance without being the functional change. A QTL is the broader statistical region implicated by the mapping analysis. Marker-assisted selection may use a validated marker linked to a useful region, but its value depends on whether that relationship holds in the target breeding material.
The site’s article on linkage disequilibrium explains why a nearby marker can remain associated with a causal variant. Recombination can weaken that relationship, especially when a marker is transferred into a different genetic background.
A Practical QTL Reading Card
When a paper reports a QTL, write a one-sentence record in this form: “In [population], using [trait measurement] under [environment], the analysis associated [mapped interval] with [direction or amount of variation].” Then add a second sentence listing what remains unresolved: the causal sequence change, the responsible gene, replication in another population, or performance in another environment.
If the paper doesn’t provide enough information to fill a field, write “not reported.” Missing provenance should remain visible rather than being filled with a plausible guess.
What a QTL Can and Cannot Support
A QTL can be a useful lead for follow-up mapping, candidate-gene research, or carefully validated selection. It can’t by itself establish a mechanism, guarantee a phenotype, or show that the same effect applies to unrelated cannabis populations. When a breeding or commercial decision depends on the claim, a quantitative geneticist or qualified plant breeder should review the population design, model, and validation evidence.
A QTL tells you where a study found a statistical relationship and under which conditions. When you describe the finding, include the population, measurement, and interval so your explanation stays within what the study demonstrated.