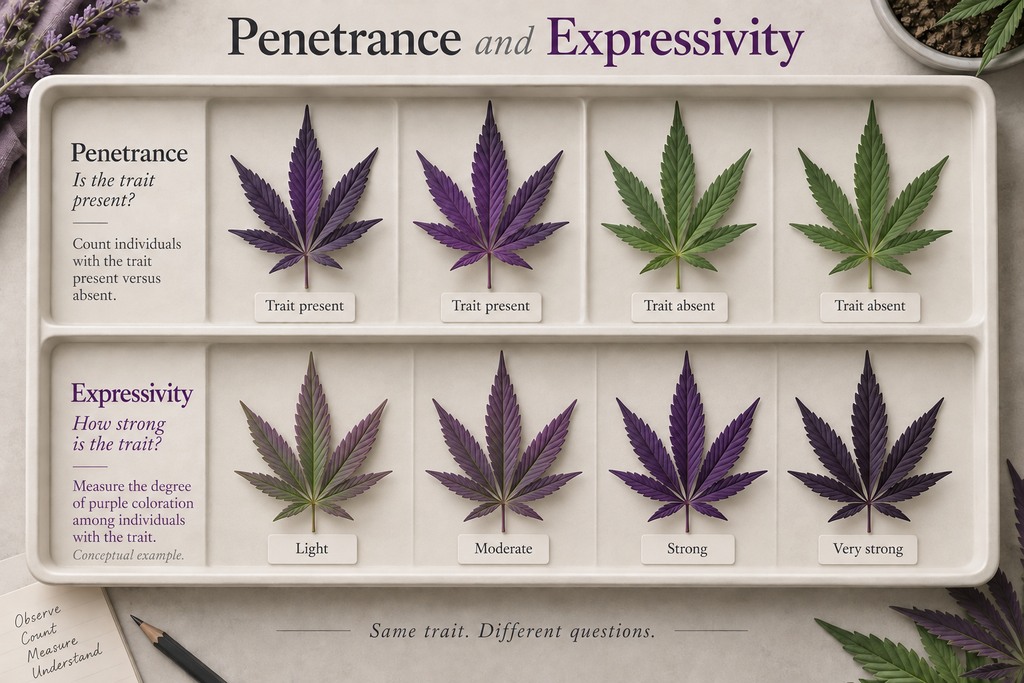
Penetrance describes how often a defined phenotype appears among individuals with a particular genotype, while expressivity describes how that phenotype varies in its form or degree. In cannabis genetics, the distinction helps you ask two separate questions: did the trait appear, and what did it look like when it did? Neither term guarantees the appearance of an individual seed-grown plant.
Start With a Defined Trait
Penetrance needs a clear yes-or-no scoring rule. Expressivity needs a way to describe or measure the phenotype’s variation. If you haven’t defined the trait or confirmed the genotype, you can still describe what you observe, but you can’t estimate penetrance for that genotype from those observations.
The National Library of Medicine explanation distinguishes incomplete penetrance from variable expressivity in human genetics. The definitions are useful here, but its medical examples don’t establish values for cannabis traits.
A Small Example Shows the Difference
Imagine a trial of 40 plants confirmed to share a particular genotype. The scoring rule counts visible purple coloration at a specified stage under specified conditions. If 30 meet that rule, the observed penetrance is 30 divided by 40, or 75%, for that sample and definition.
The calculation doesn’t say the trait is 75% purple. Among the 30 positive plants, you could separately record faint, moderate, or strong coloration using the same reference scale. That variation concerns expressivity.
These numbers are hypothetical, not a measured cannabis estimate. A small sample, a different stage, or a different threshold could produce a different proportion, and a useful report would include uncertainty rather than applying the percentage to every seed lot.
Why the Scoring Threshold Matters
If you count only strongly colored plants as positive, you may classify plants with a weak but visible phenotype as absent. Changing that threshold after seeing the results can change the apparent penetrance without changing any plant’s biology.
Choose the scoring rule first, retain the raw observations, and explain borderline cases. For visual scoring, use consistent lighting and reference images; for a laboratory trait, retain the assay method and detection limit.
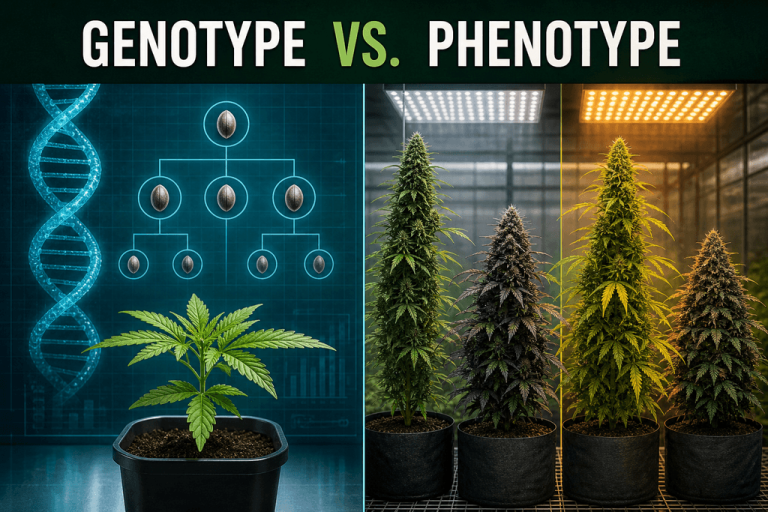
The distinction between genotype and phenotype explains why a shared variant doesn’t make every observed characteristic identical. Other inherited variants, environmental conditions, and measurement choices can contribute to what you see.
Record Occurrence and Degree in Separate Fields
- Identify the plant and the genotype or assay call being evaluated.
- Record the developmental stage and relevant environment.
- Apply the predefined presence-or-absence rule.
- Record the phenotype’s degree or form using the chosen scale.
- Keep missing observations separate from negative scores.
- Summarize the proportion positive and the distribution of expression separately.
A missing sample isn’t evidence that the trait was absent. And a negative phenotype isn’t enough to prove the relevant allele is absent; a genetic assay and an observed trait answer different questions.
What These Terms Can’t Diagnose
Variation alone doesn’t identify its cause. If the response changes across conditions, investigate genotype-by-environment interaction. If the assay is a marker near the causal locus rather than the causal variant itself, linkage and assay performance may also matter.
For breeding claims or a proposed DNA test, ask a qualified plant geneticist whether the phenotype definition, sample size, and genotype evidence support the estimate. No general penetrance percentage should be assigned to an unspecified cannabis seed type.
What to Ask Before Trusting a Prediction
If someone says a genotype reliably produces a trait, ask how they scored presence, how they measured degree, which plants they counted, and under what conditions. For simple inheritance predictions, Mendelian inheritance supplies the starting model, while penetrance and expressivity help you describe where observed outcomes need more care.
In your records, give trait presence and trait degree their own fields. You’ll then be able to tell whether fewer plants show the trait, whether its appearance varies among those that do, or whether both are happening.