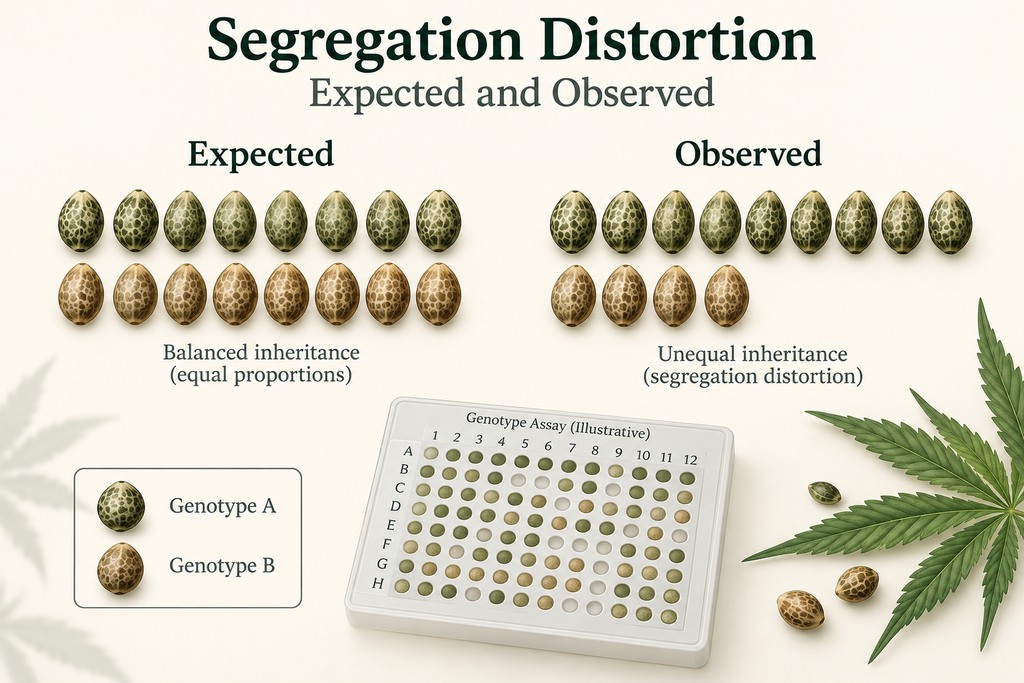
Segregation distortion is a departure from the genotype or allele proportions expected under a specified inheritance model. In cannabis genetics, an unexpected ratio may reflect transmission or survival differences, but it can also arise from sampling, genotyping errors, or an incorrect model. The first task is to establish where the mismatch entered the data.
State the Expected Ratio First
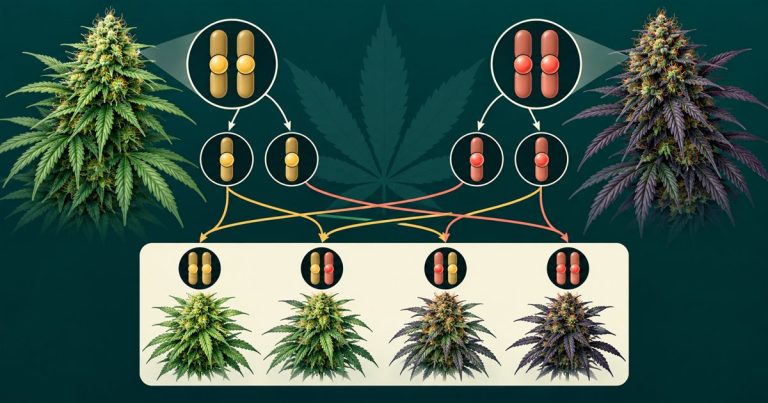
A ratio only becomes a testable expectation when you know the parental genotypes and the cross. In a simple diploid model, an Aa by Aa cross gives an expected AA:Aa:aa genotype ratio of 1:2:1. An Aa by aa cross gives 1:1 for Aa:aa. Those expectations depend on the model’s assumptions.
Review Mendelian inheritance before testing a deviation. A phenotypic ratio isn’t automatically a genotype ratio, particularly when trait scoring or incomplete expression obscures the inherited state.
Segregation distortion is therefore a description of a departure that needs explanation. It isn’t a mechanism by itself.
Why Observed Counts Can Depart
Biological possibilities include unequal gamete success, fertilization differences, and genotype-dependent survival. But a mislabeled family, pollen contamination, allele dropout, or nonrandom removal of plants can also alter the observed counts.
A cannabis pangenome study reported distortion across genomic regions and considered structural variation as a possible contributor to transmission biases. That gives researchers a possible explanation to investigate, but it doesn’t establish why a particular marker departs from expectation in your family.
What the Counts Can Tell You
In an illustrative family of 100 offspring, a 1:2:1 model expects 25, 50, and 25 plants. Observing 35, 50, and 15 is a mismatch worth evaluating, but the counts alone don’t tell you whether transmission, survival, or a technical error produced it.
The appropriate statistical test depends on sample size, expected counts, relatedness, and how many markers you tested. A nominally significant result among thousands of tests needs multiple-testing control. Ask a qualified statistical geneticist to review the design rather than using a single ratio cutoff as a verdict.
Trace the Sample Through Its Stages
- Check the cross record. Confirm parent identity, generation, ploidy, and the model used to calculate expectations.
- Audit genotyping. Compare missing calls, read support, replicate agreement, and allele balance where the assay permits.
- Check inclusion rules. Record which seeds or plants were sampled, excluded, lost, or selected before analysis.
- Compare available stages. If genotypes were measured before and after a survival interval, ask whether the departure appeared or increased during that interval.
- Inspect neighboring markers. A coherent region can be more informative than one isolated poor-quality call, although shared assay bias remains possible.
- Repeat independently. Use another family, assay, or sampling event suited to the proposed explanation.
Later seedling counts can’t reconstruct genotypes that were never measured in ungerminated seeds. Record that blind spot instead of claiming to have identified when the bias began.
Keep the Signal Without Overinterpreting It
For genetic mapping, distorted markers may carry biological information, but they can also complicate analysis. Don’t automatically remove every departure or retain every one. Preserve the raw data and compare results under a documented quality policy.
If a departure occurs near a quantitative trait locus, check whether genotype-dependent survival or missingness could also bias the trait association. The fact that a region maps to a trait doesn’t settle why its genotype counts differ.
Decide What to Check Next
Keep the expected ratio, observed counts, sample stage, exclusions, assay checks, statistical method, and unresolved alternatives together. Use linkage disequilibrium to understand regional relationships, while retaining the distinction between population associations and transmission in a specific cross.
Choose the next check from what the records leave unresolved. If calls are unreliable, check the assay before interpreting transmission. If the assay holds up but losses weren’t tracked, an earlier sample in a repeat trial may help. A replicated cross can test whether the departure recurs, but it won’t recover the missing stages of the original family.